

I love using click tracking heat maps because you can create them with an almost zero effort. It takes some experience to read them in the right way, but once you learn that, it becomes a great way to improve the usability of a website and help you push the conversions in a way you want!
Wait a second, what is a heat map?
Heat maps are visual representations of the interactions that a user makes with an interface. The color shows you where the “warmer” and the “colder” spots are, accordingly to how many interactions have been made in a certain area.
1. One photo can make the difference
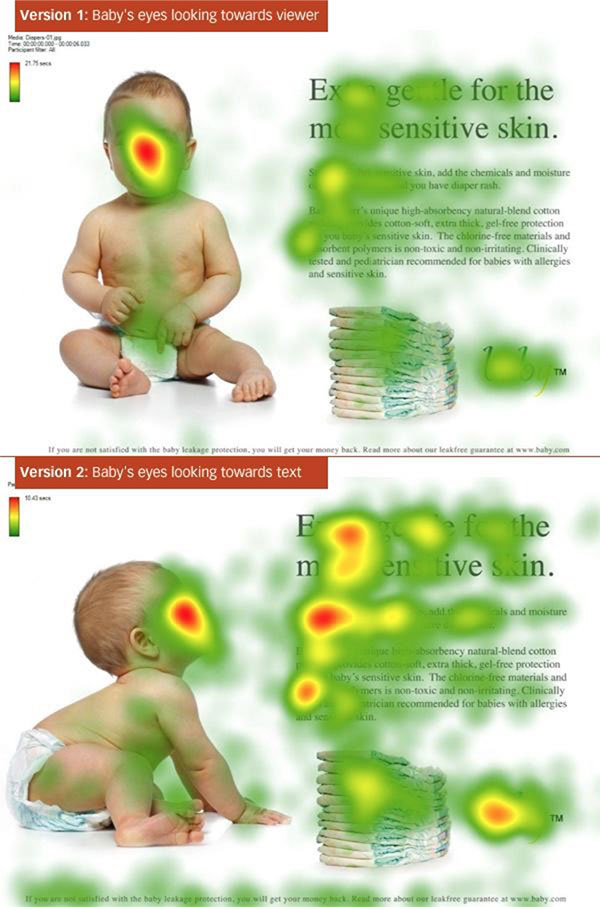
This kind of heat map was made by tracking the movement of the user’s eye gaze across the screen.
In this first picture a photo was tested where the baby was looking towards the viewer. A lot of views on the baby, many happy users… but sadly there where few conversions.
When the marketers turned around the photo and let the baby look towards the text, the conversion rates improved drastically.
Positioning the point of gaze on the text or on your “call to action”, will help you bringing the attention towards your content.
What we’ve learned is that by publishing an image of a person, the user’s eyes will follow the image’s eye line. You can use this little trick to help you improve the conversion rates! Generally speaking, we can say that images of people should always face the text instead of the viewer.
2.Webpage heatmap: we live in a western world
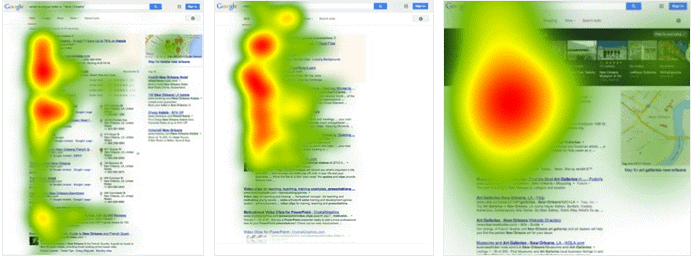
People generally look more at the left side of the screen. Why? Certainly it depends on how the text is being aligned on the page. But I think the main reason is that people in the western world read from left to right, top to bottom.
This doesn’t mean we should put our “call to action” on the left side of the screen, but since people start reading websites from left to right, top to bottom, the top left content will get their attention first. Thanks to this info, we can create the content that drives the users’ attention as soon as possible to your action area.
3. Heat maps and bug fixing: a love story
In this example we can see a mouse click detection heat map on a travel websites we needed to improve the conversion rates. We saw that everybody was clicking on the date picker, but we could not explain why.
After a recording some browser sessions with Hotjar we found out that the date picker on some Android browsers was hidden underneath the search button. A big percentage of users couldn’t choose a date! After this change, the conversions on the site improved by 18%. Heat maps can be a great way to spot bugs on your website!
4. Keep the juice “above the fold”
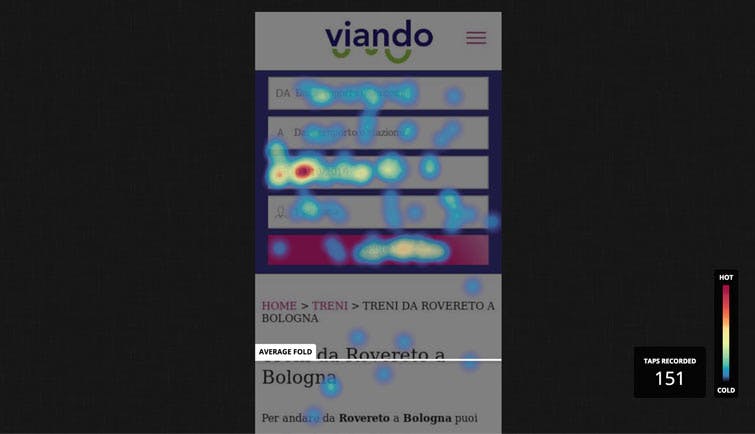
The “average fold” of your website is the magical line you shall not pass (cit.). Just kidding, of course you will need to use that area too. We know that by scrolling down just a few pixels you will loose a big, big percentage of viewers. All your important “action areas” should be above the fold.
This example has been created by tracking the vertical scrolling movement of 2000 users on a webpage.
What we can learn is that only people who need more time to understand your products and services are going to scroll under the fold, because they want to get more info. This means that we should get rid of all the distractions and put the juice on top!
5. A/B testing is the key
Almost all the previous points could never have been done without it. Conversion rate improvements most likely come along with A/B testing. You think something could be improved? try to create an alternative or two. Start testing it and try to include a heat map next time. This combination might reveal something you would not expect!
These are my top 5 heat map services to get you started
1. Hotjar is a really precious tool, considering that can easily create a few heat maps at the time, download them and create more… for free!
2. Sadly Crazy Egg is not a free service anymore, but you can get a free 60-day trial!
3. Mockingfish will help you combine A/B testing and heat maps, great service, free for one year.
4. ptengine is not as good as the ones we’ve seen before, but, hey it’s free.
5. We have met one of the founders of EyeQuant and he explained to us that it is not a common tracking service. Artificial Intelligence predicts which parts of your design are most and least eye-catching, so you can make sure that your most important content is visible right away. Is it free? No, but it provides a great alternative to eye-tracking services.


